
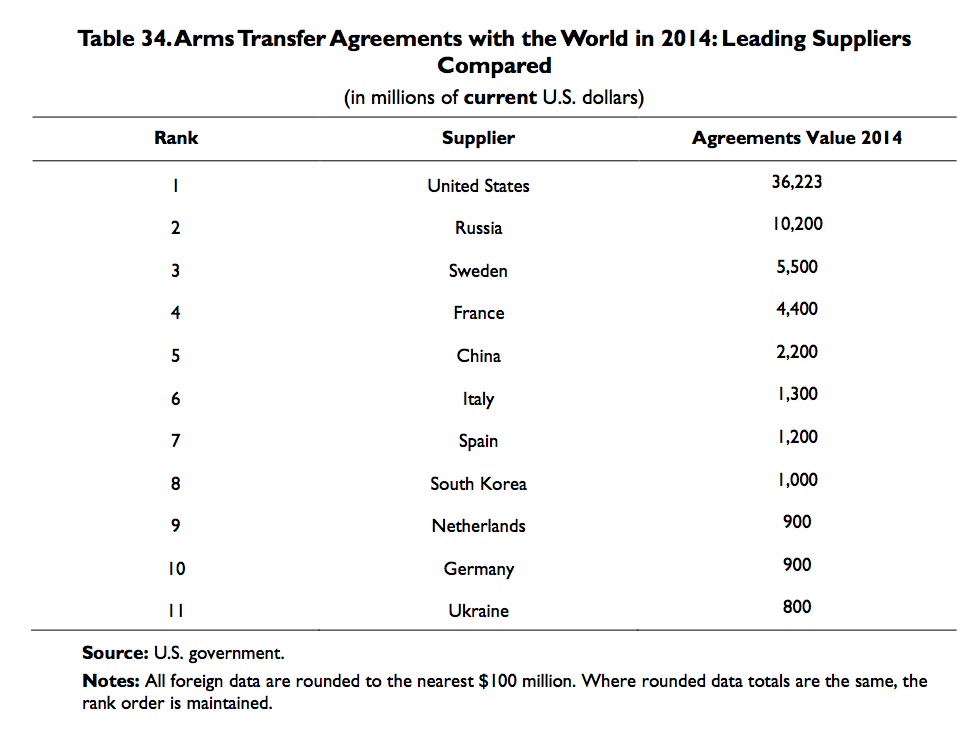
Last year, the United States led the world in arms sales, with a total of $36.2 billion in worldwide arms transfer agreements. Russia took a distant second place with $10.2 billion in agreements, out of a global total of $71.8 billion in 2014.
In other words, according to new report from the Congressional Research Service on “Conventional Arms Transfers to Developing Nations, 2007-2014” (pdf), dated 21 December 2015, the United States is far and away the number one military-industrial complex in the world.
Here are excerpts of an analysis of the report from the New York Times:
Foreign arms sales by the United States jumped by almost $10 billion in 2014, about 35 percent, even as the global weapons market remained flat and competition among suppliers increased, a new congressional study has found.
American weapons receipts rose to $36.2 billion in 2014 from $26.7 billion the year before, bolstered by multibillion-dollar agreements with Qatar, Saudi Arabia and South Korea. Those deals and others ensured that the United States remained the single largest provider of arms around the world last year, controlling just over 50 percent of the market.
Russia followed the United States as the top weapons supplier, completing $10.2 billion in sales, compared with $10.3 billion in 2013. Sweden was third, with roughly $5.5 billion in sales, followed by France with $4.4 billion and China with $2.2 billion. . .
The report to Congress found that total global arms sales rose slightly in 2014 to $71.8 billion, from $70.1 billion in 2013. Despite that increase, the report concluded that “the international arms market is not likely growing over all,” because of “the weakened state of the global economy.”
It was the second successive year that global sales remained steady, suggesting that the market has begun to level off after several years of extreme fluctuation.
Here are the totals, in constant 2014 dollars, for the 2007-2014 period:

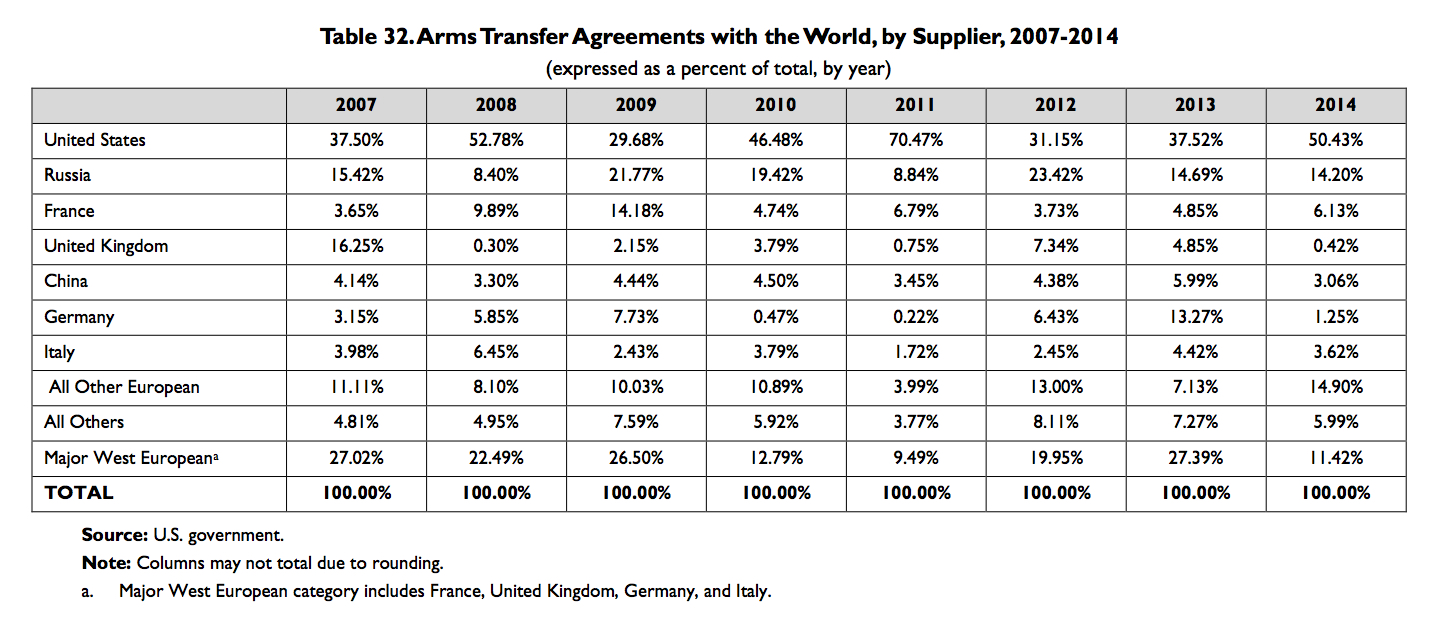
And the percentages of the total for the major exporters over the same period:
For the past seven years (and, of course, much longer), the vast majority of arms sales have been from developed to developing countries, especially in the Middle East and Asia:

